Dynamic updating of post-earthquake loss estimates
The widespread earthquake damage to the built environment induces severe short- and long-term societal consequences. Better community resilience may be achieved through well-organized recovery. Decisions to organize the recovery process are taken under intense time pressure using limited, and potentially inaccurate, data on the severity and the spatial distribution of building damage.
In this work, we suggest to encode domain knowledge in ordinal Gaussian process regression to update parts of the regional earthquake risk model using early damage reports from building inspection. The updated model is then used to issue post-earthquake loss estimates with increasing accuracy and precision.
More information
Bodenmann L., Reuland Y. and Stojadinović B. (2022): Dynamic post-earthquake updating of regional damage estimates using Gaussian processes; Reliability Engineering & System Safety.
View at publisher code
Regional earthquake risk model
The following contains a simplified summary of the typical workflow for such regional analyses. More detailed descriptions can be found in the excellent book by Baker, Bradley and Stafford1, and in the highly recommended report by Deierlein and Zsarnóczay2.
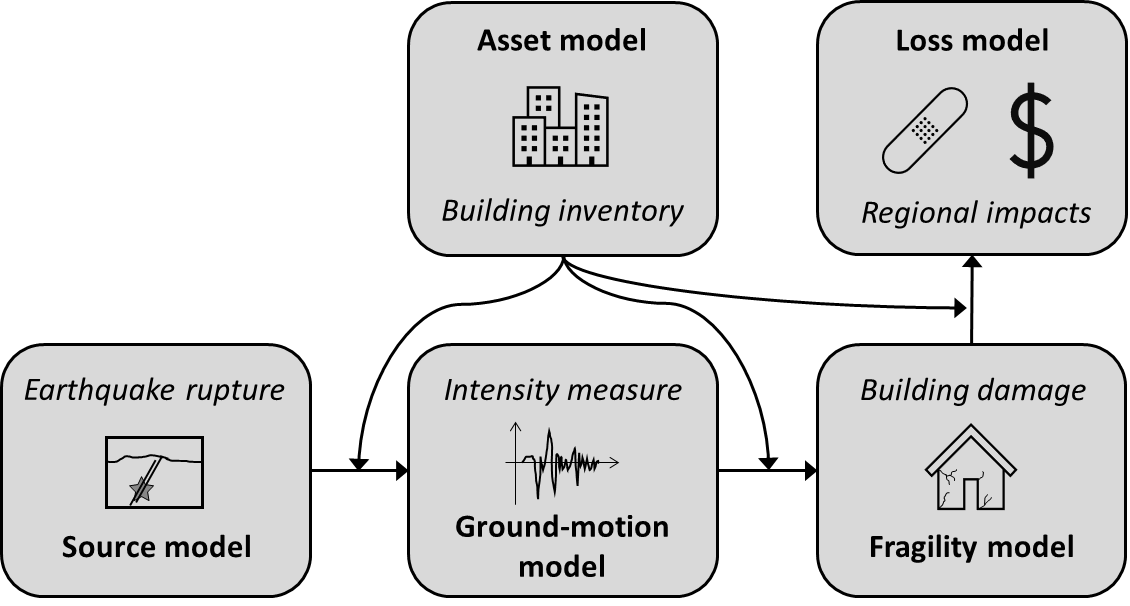
The asset model assembles the necessary information about the system of interest. In our case this is the building inventory of a specific region. The information pertains to the geographic locations of the individual buildings, their age, and some information on their geometries (such as their height). When information is missing, the asset model specifies how we estimate missing information for the subsequent computations.
The source model consists of the characterization of potential earthquake ruptures that may affect the region of interest. It is typically derived via statistical analyses of historical earthquake events in combination with physical constraints and geodesic measurements.
The ground-motion model predicts the level of ground-shaking at the surface induced by a specific earthquake rupture. Typically, ground-shaking is expressed via intensity measures such as peak ground acceleration. There exist empirical and physics-based ground-motion models that provide probabilistic estimates of such intensity measures at the geographic locations of interest. Here we focus on empirical models, which model the spatial distribution of the intensity measure(s) as a stochastic process (also called random field). In our paper3, we explain how such models can be expressed as Gaussian processes (GPs).
The fragility model estimates the building damage as a result of a certain level of ground-shaking. Such models are derived via high-fidelity structural models of archetype buildings, and empirically using damage data from past earthquakes. In the following, we assume that building damage is described via discrete categories (e.g., none, slight, …, complete), so-called damage states.
The loss model computes system-wide losses as a result of the individual component damage states. For buildings, one could model the number of injured persons for each building as a function of its damage state and then compute the total number of injured persons by aggregating over all buildings. Similar computations may be done for direct financial losses (i.e., repair costs).
Several countries and states developed regional earthquake risk models: For Italy, Dolce et al.4 introduce the relevant components.
The post-earthquake situation
In the immediate aftermath of an earthquake, it is imperative to use the early-arriving shaking intensity and building damage data as soon as possible to constrain the uncertainty of regional damage estimates and to organize recovery. Below, I explain the inference steps that use the ground motion intensity data measured by seismic networks, and the building damage and typological data obtained by inspection.
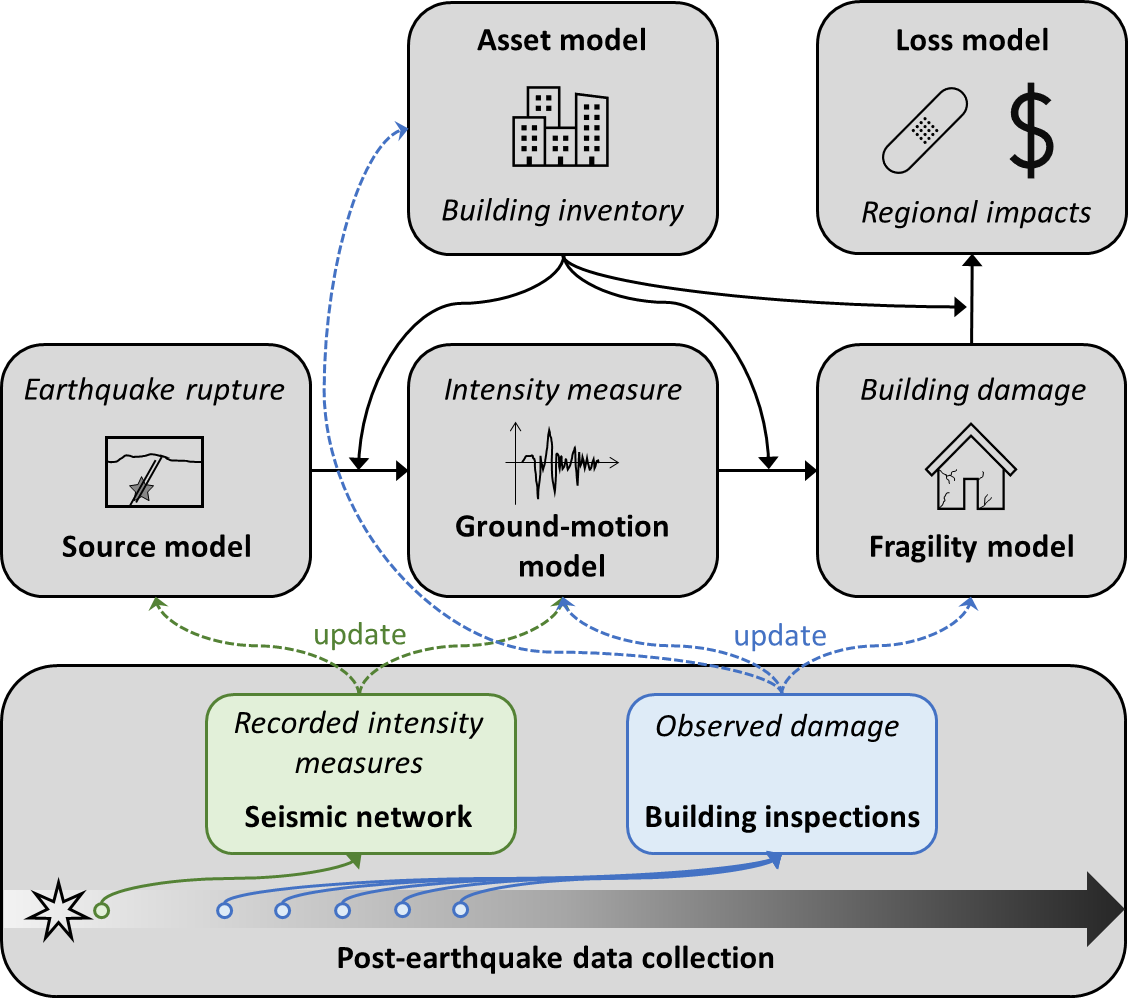
Within minutes after the event, ground-motion recordings from a seismic network become available. These are used to: (i) determine characteristics of the occurred rupture (such as its magnitude, location and extent), and (ii) constrain ground-motion estimates (analogous to current shake map systems). Because the spatial distribution of (logarithmic) intensity measures can be expressed as a GP, step (ii) is essentially equivalent to GP regression5.
Then, first damage estimates are obtained by including the determined rupture characteristics and the constrained ground-motion estimates in the regional risk model.
Within hours and days after the event, public agencies and volunteers start with building inspection. Through visual assessments, experts estimate the building condition. Based on this information, officials decide whether a damaged building is safe enough to be re-occupied by its residents, and public agencies and NGOs plan the response and recovery efforts.
Typically, the inflicted damage is stated in terms of a certain damage category. Here we assume that those categories are consistent with the damage states employed in the fragility model of the risk model. Besides this damage description, experts also provide some basic building attributes that were not known prior to the event, e.g., the dominating material of the lateral load-resisting system and its type.
While completing the entire inspection campaign may take weeks to months, our proposed framework dynamically ingests data from the first inspected buildings to deliver increasingly accurate and precise predictions. Specifically, we use the data to perform uptades in following two steps.
Based on the damage data, we estimate an updated spatial distribution of ground-motion intensity measure (i.e., an updated shake map), while in parallel updating the fragility model. This is achieved via ordinal GP regression6 and variational inference7.
Case studies
We tested the proposed framework in three case-studies: (a) a simulated earthquake event affecting Zurich (Switzerland), (b) the 1998 Pollino earthquake in Italy, and (c) the 2010 Kraljevo earthquake in Serbia.
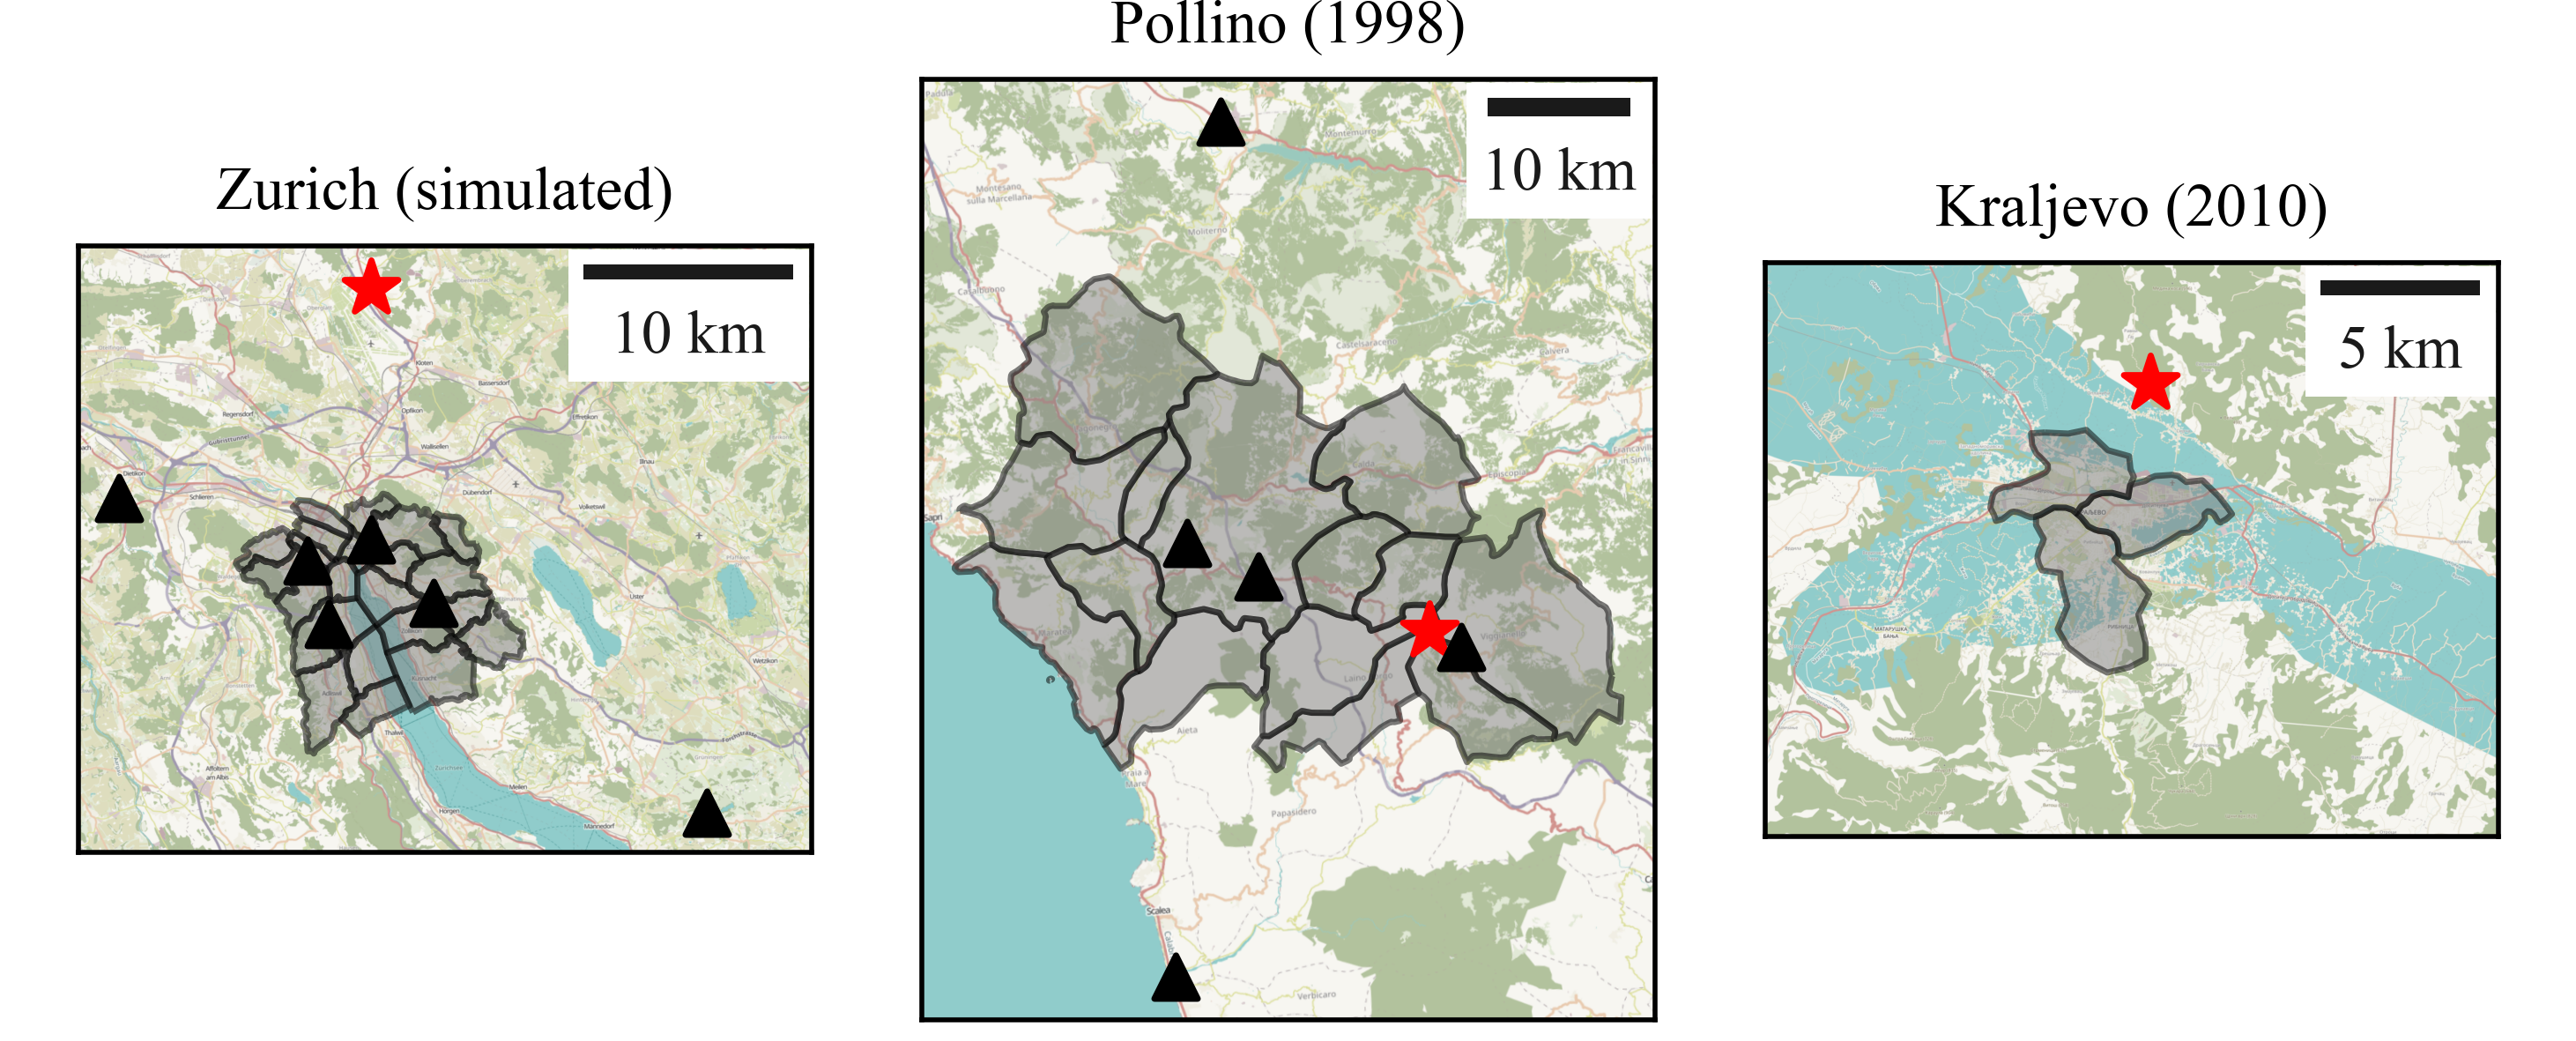
Zurich
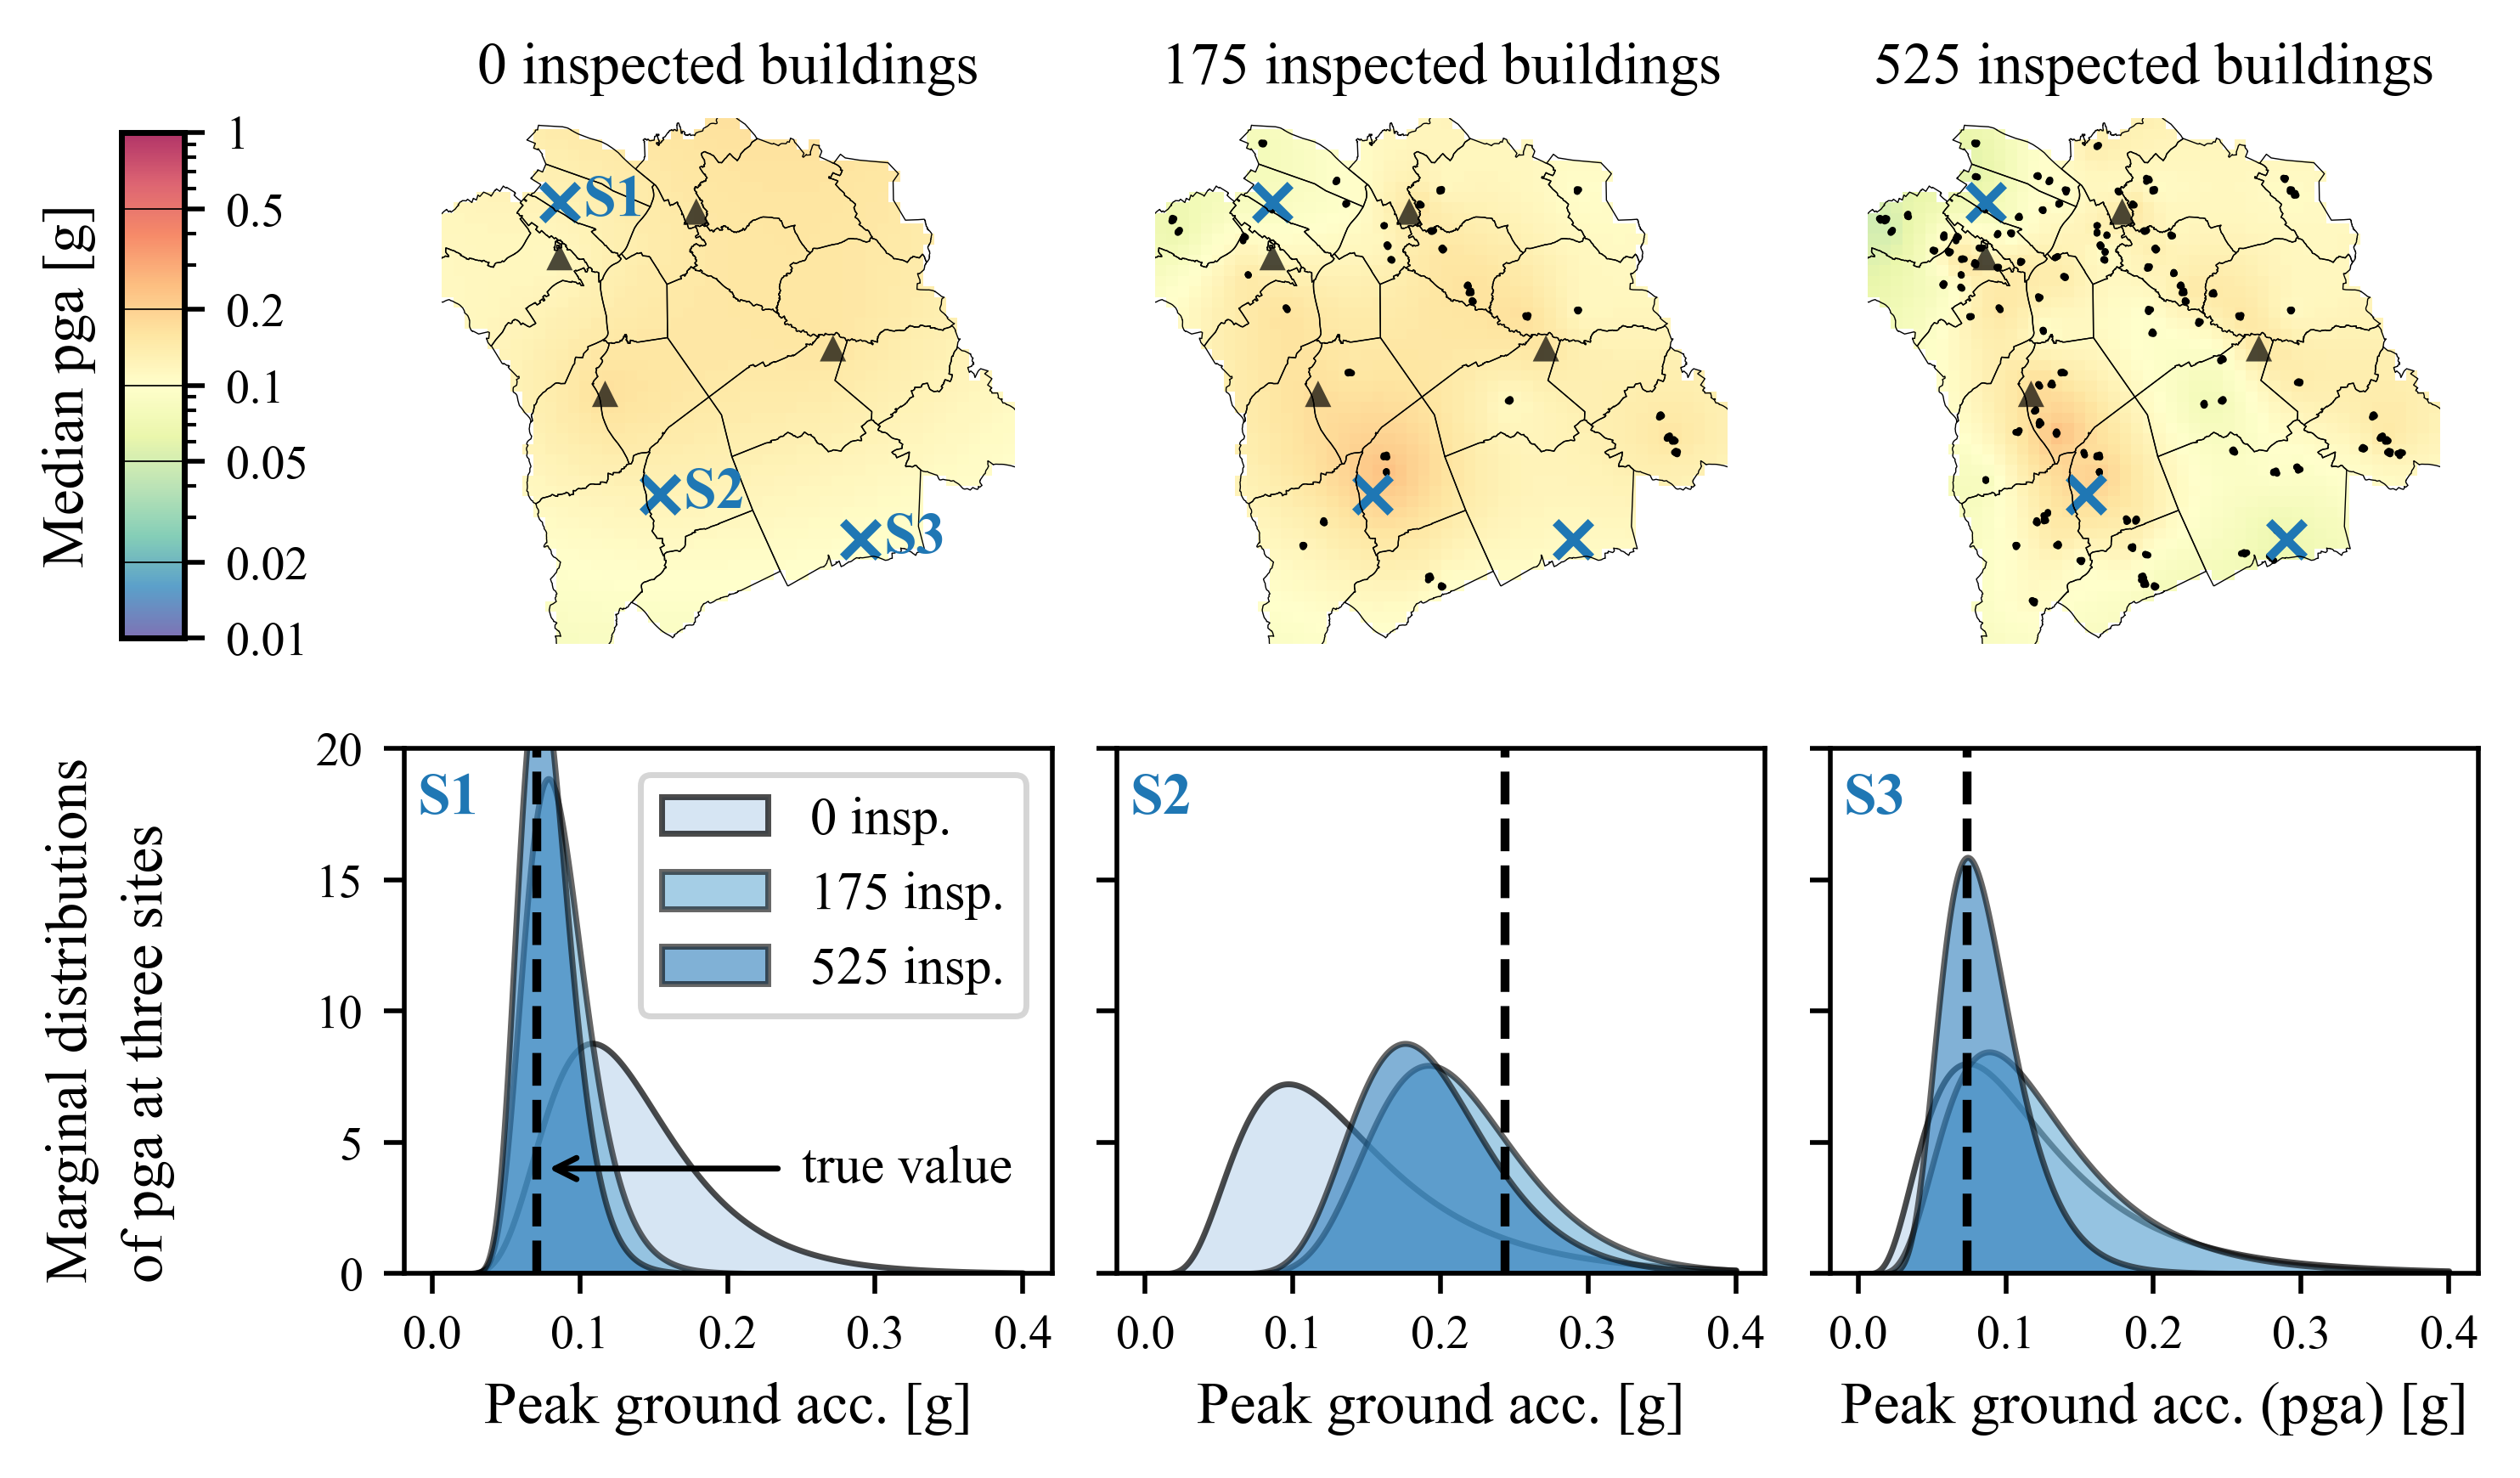
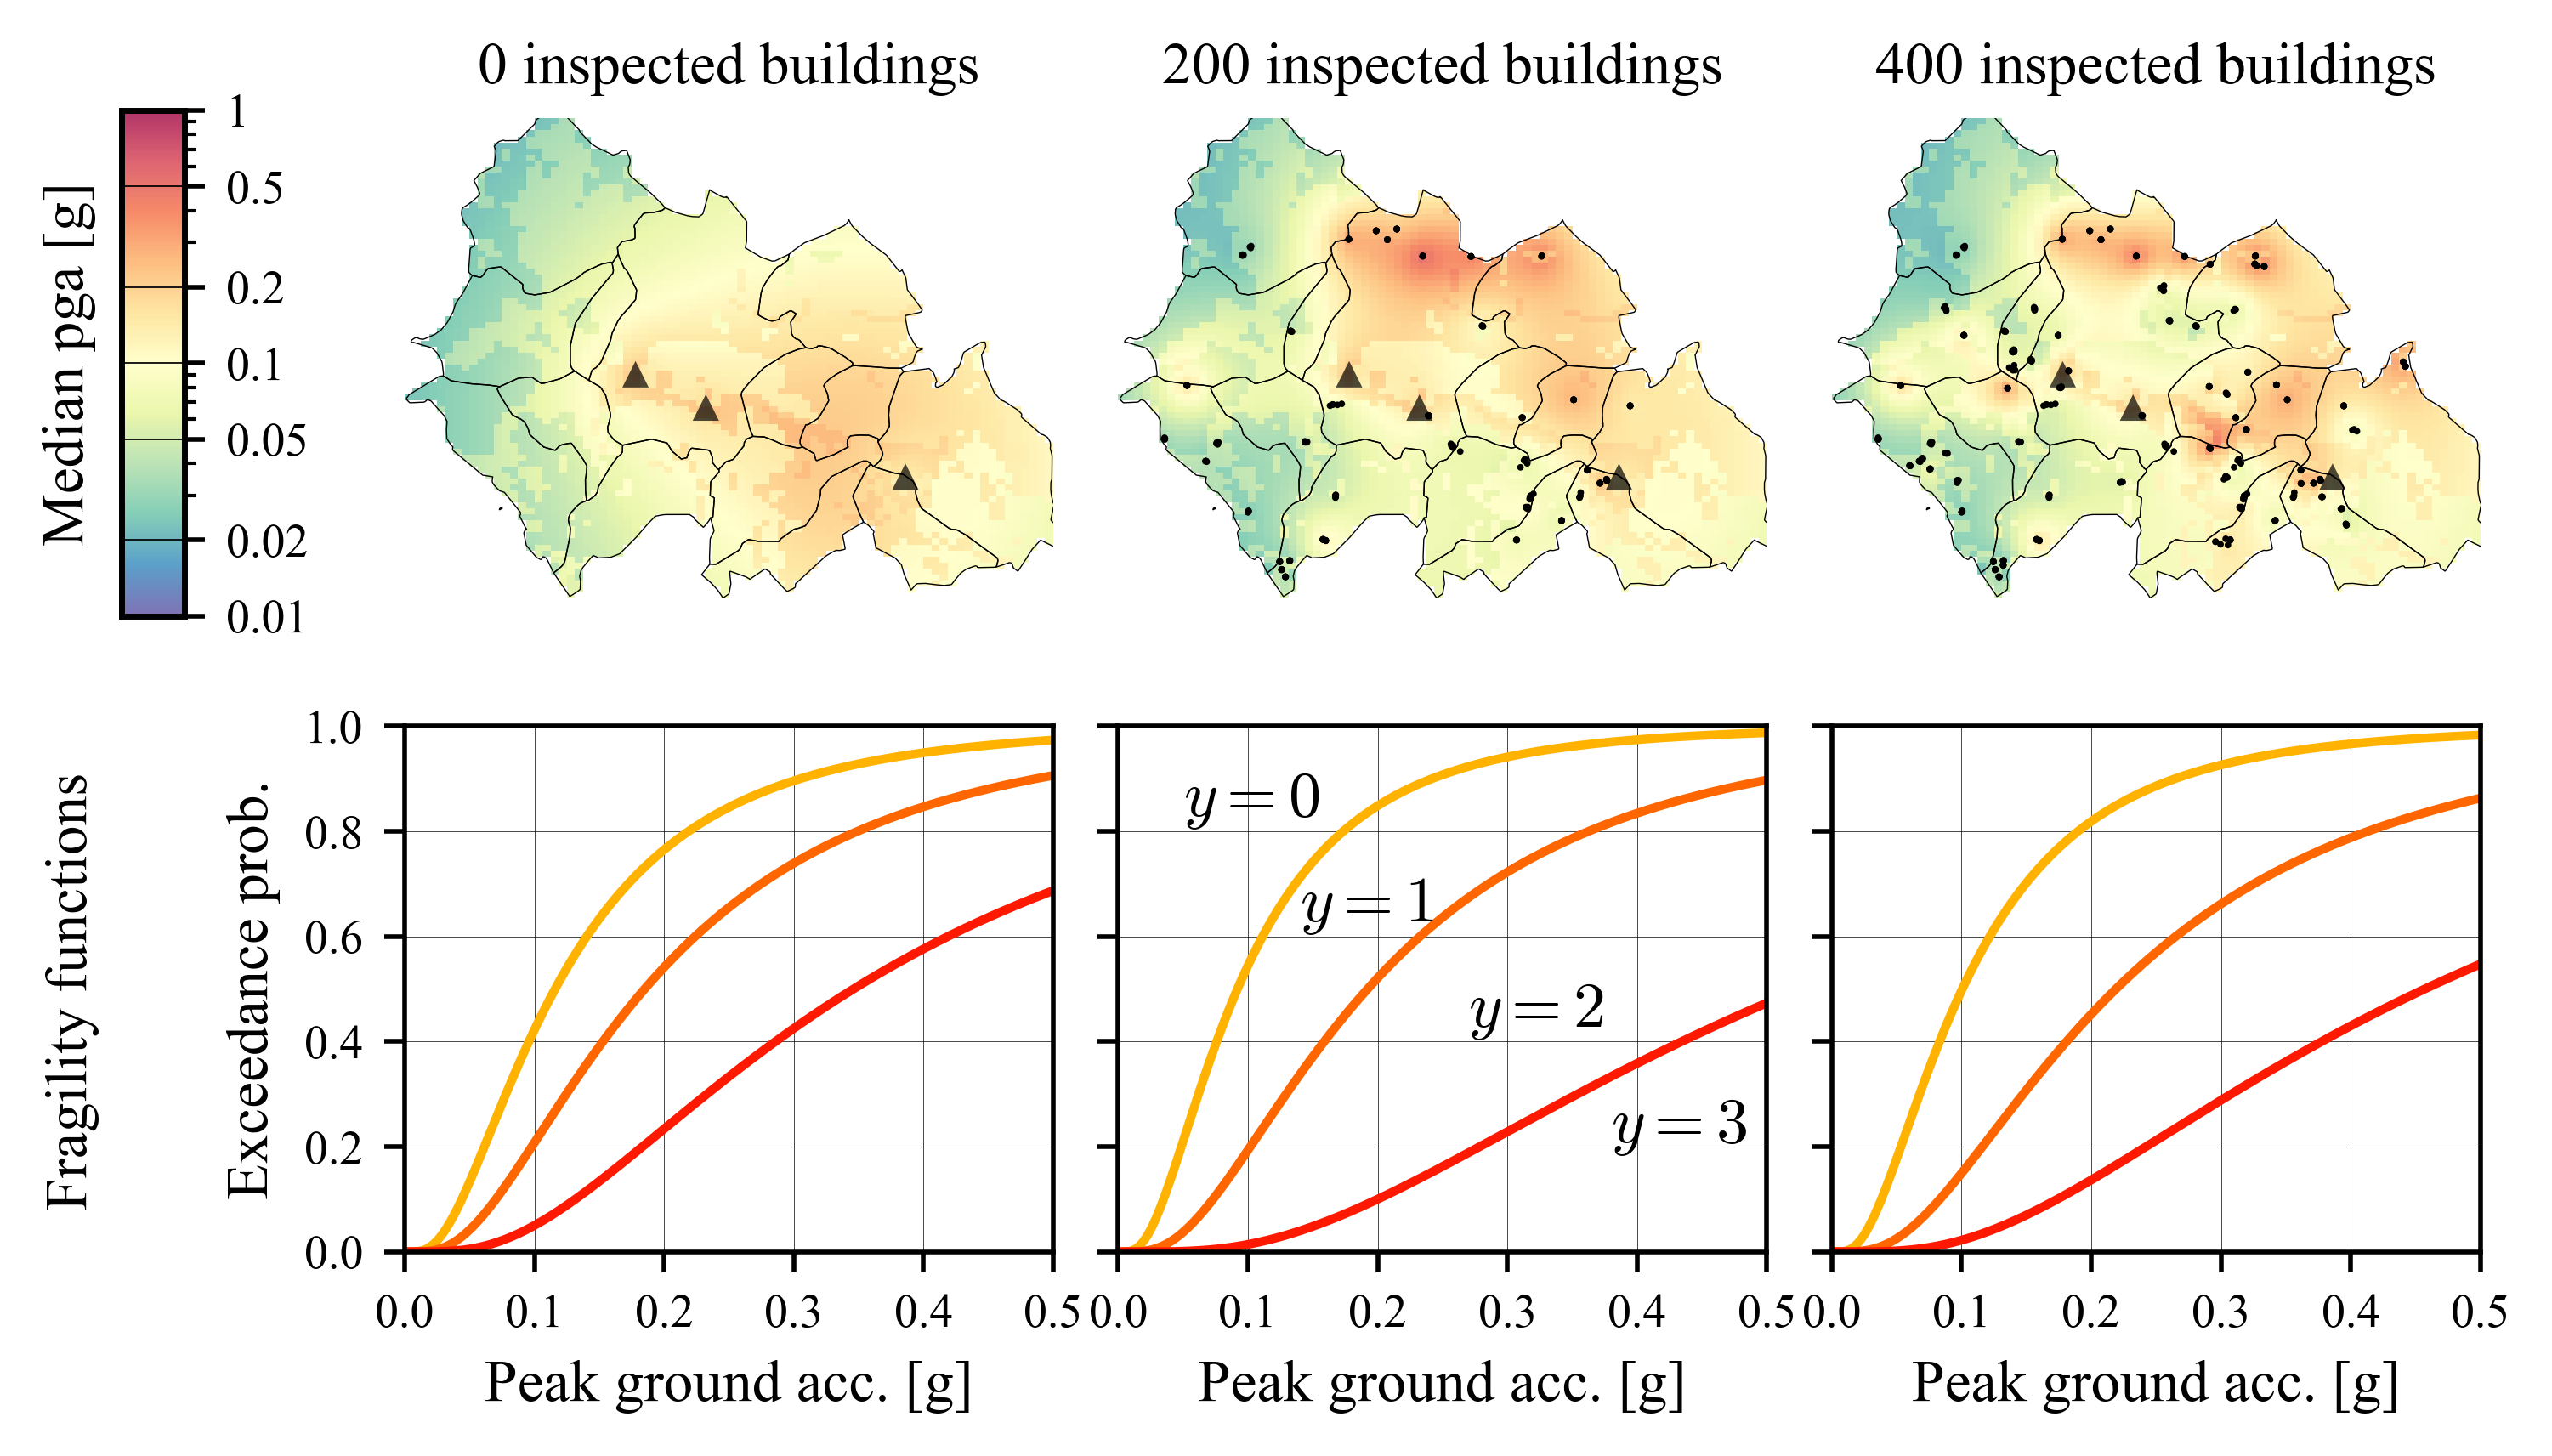
The simulated case study is used to analyze the performance of the proposed RMGP framework in updating the random field of intensity measures, which in this case is expressed as peak ground acceleration. The uncertainty at specific locations is reduced, especially when buildings in the vicinity of the location get inspected, as evidenced by the uncertainty reduction after 175 inspections for locations S1 and S2. The variance at location S3 is reduced only after 525 buildings are inspected, some of which close to the location S3.
Pollino
As outlined above, RMGP leverages inspection data not only to constrain the distribution of the ground motion IMs, but also to update the fragility model parameters as shown in the bottom row of the figure below. The evolution of the estimated fragility curves for one specific building type in the bottom row. While updating does not change the vulnerability curve for the slight damage state (delimiting $y=0$ from $y=1$), the initial vulnerability curve for the extensive damage state shifts towards less conservative predictions after updating using inspection outcomes. Such updated vulnerability curves may be useful in case of aftershocks in the same region, or to develop risk models in other regions with similar building inventories.
Compared to the Zurich case study, the Pollino region is almost ten times larger and has a sparse seismic network, which results in larger heterogeneity of the inferred median PGAs as shown in the top row of the figure below.
Comparison to random forest and linear regression
Finally, we will compare the predictive performance of RMGP to two other regression / classification techniques: Random forests and ordered linear probit regression. The predictive performance is quantified using the joint prediction error cumulated over all subregions. The joint prediction error is an extension of the continuous ranked probability score and suitable for quantifying errors of probabilistic forecasts.
We simulate 50 random (but spatially correlated) inspection sequences. Thus at each timestep we have 50 error values whose distribution are indicated with the violin plots.
Overall, the proposed RMGP framework performs better than purely data-driven models, such as RF. Our focus on the early aftermath, with very few inspected buildings, undermines data-driven methods that, typically, require large training sets. In addition, GP models account for dependencies in the predictions of multiple, spatially distributed outputs. This is particularly important in cases where aggregated damage statistics are of interest. Note that all methods perform inference in less than 40 seconds on a personal computer and for the maximum number of inspected buildings considered.
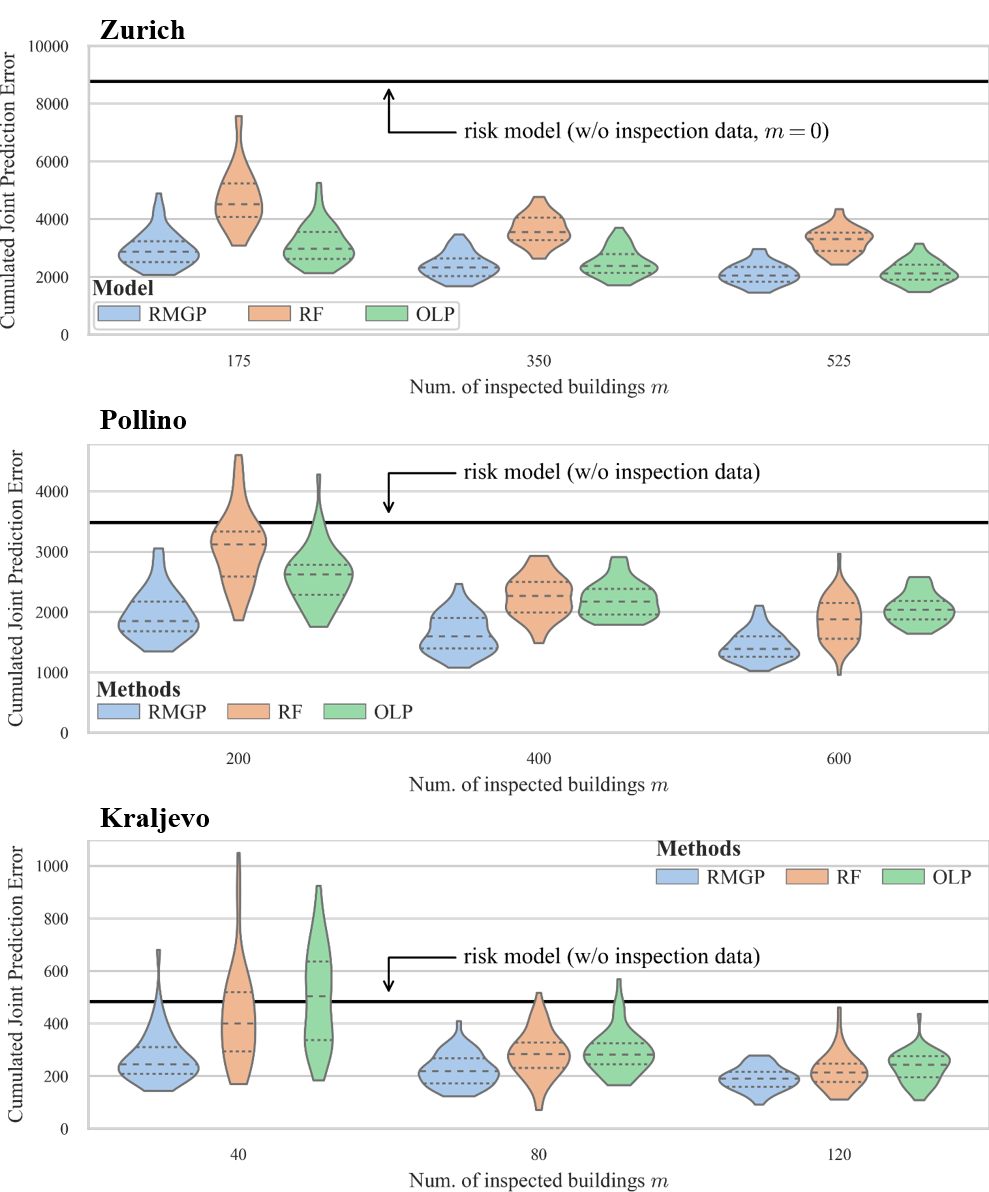
The first, simulated, Zurich case study shows that despite a relatively dense seismic network, the initial predictions from the assumed prior risk model may be inaccurate. Updating the components of the risk model using early-arriving building damage inspection data rapidly captures the actual trend in the data and thus, provides reliable regional damage estimates after a fraction of the time that would be required to inspect the entire city.
This is also confirmed in the case of Pollino, where the initial risk-model predictions are more accurate despite the less dense seismic network. While the numbers of inspected buildings at each time step are similar in Zurich and Pollino case studies, we used substantially less inspection data in the case of Kraljevo. The first time step is limited to 40 inspected buildings, which translates to a larger span in CJPEs from different inspection sequences.
Summary
RMGP is a dynamic updating framework for regional post-earthquake damage estimation that leverages early-arriving observations of ground motion intensity and building damage using Gaussian processes and variational inference. The framework updates the ground motion intensity, building type attribution and fragility model components of a regional earthquake risk model that is established prior to the event.
Based on the three case studies we conclude that:
- RMGP framework provides a powerful tool to combine inspection evidence with prior estimates of traditional risk models, thus enabling precise and accurate predictions of earthquake-inflicted impacts on residential buildings in a fraction of the time required to inspect the entire building stock.
- RMGP requires less data compared to the purely data-driven machine-learning approaches, such as random forest models, to provide these estimates.
These results highlight the potential of RMGP for operational use after future earthquakes. Yet there are some caveats.
Caveats and opportunities for further research
- An operational use of RMGP requires close collaboration between risk modellers and agencies responsible for planning the inspection process. Future work may involve understanding the effect of different inspection prioritization schemes on the updated predictions, especially in presence of possibly biased inspections, and could further include an active-learning based strategy that optimizes information gain for the RMGP framework.
- It should be noted that the RFs, used for comparison in this paper, are taken from post-earthquake damage prediction literature. Considering the rapid evolution of machine-learning tools, better RF models or models based on other approaches, such as neural networks, may outperform the herein adopted versions of data-driven models.
- While this study focuses on conventional post-earthquake data sources (e.g., seismic network stations and building inspections), there are numerous other data sources which provide helpful and important information for post-earthquake response. Satellite and aerial imagery, for example, offer high coverage information that could potentially be combined with the proposed RMGP framework to an ensemble model delivering improved quantitative damage estimates.
References
-
Baker J., Bradley B., and Stafford P. (2021): Seismic Hazard and Risk Analysis ↩
-
Deierlein G.G., and Zsarnóczay A. (2021): State of the Art in Computational Simulation for Natural Hazards Engineering (Version v2). Zenodo. ↩
-
Bodenmann L., Reuland Y., and Stojadinović B. (2023): Dynamic post-earthquake updating of regional damage estimates using Gaussian processes, Reliability Engineering and System Safety ↩
-
Dolce M., Prota A., Borzi B. et al. (2021): Seismic risk assessment of residential buildings in Italy, Bull. of EQ Eng ↩
-
Rasmussen C.E., and Williams C.K.I. (2006): Gaussian Processes for Machine Learning, The MIT Press ↩
-
Chu W., and Ghahramani Z. (2005): Gaussian Processes for Ordinal Regression, Journal of Machine Learning Research ↩
-
Opper M., and Archambeau C. (2009): The variational gaussian approximation revisited, Neural Computation ↩