ShakemapSim: Modelling conditional ground-motion intensity measures
| code | Zenodo doi |
ShakemapSim is a tool generate spatially correlated fields of ground-motion intensity measures (IMs) conditional on available recordings from a seismic network. This enables regional post-earthquake loss assessments and is particularly useful for validation and development of models for damage, loss and recovery predictions using data gathered after an event. The tool comes with rich documentation, is easily customizable and can be run on hosted Jupyter notebook services (i.e., Google Colab).
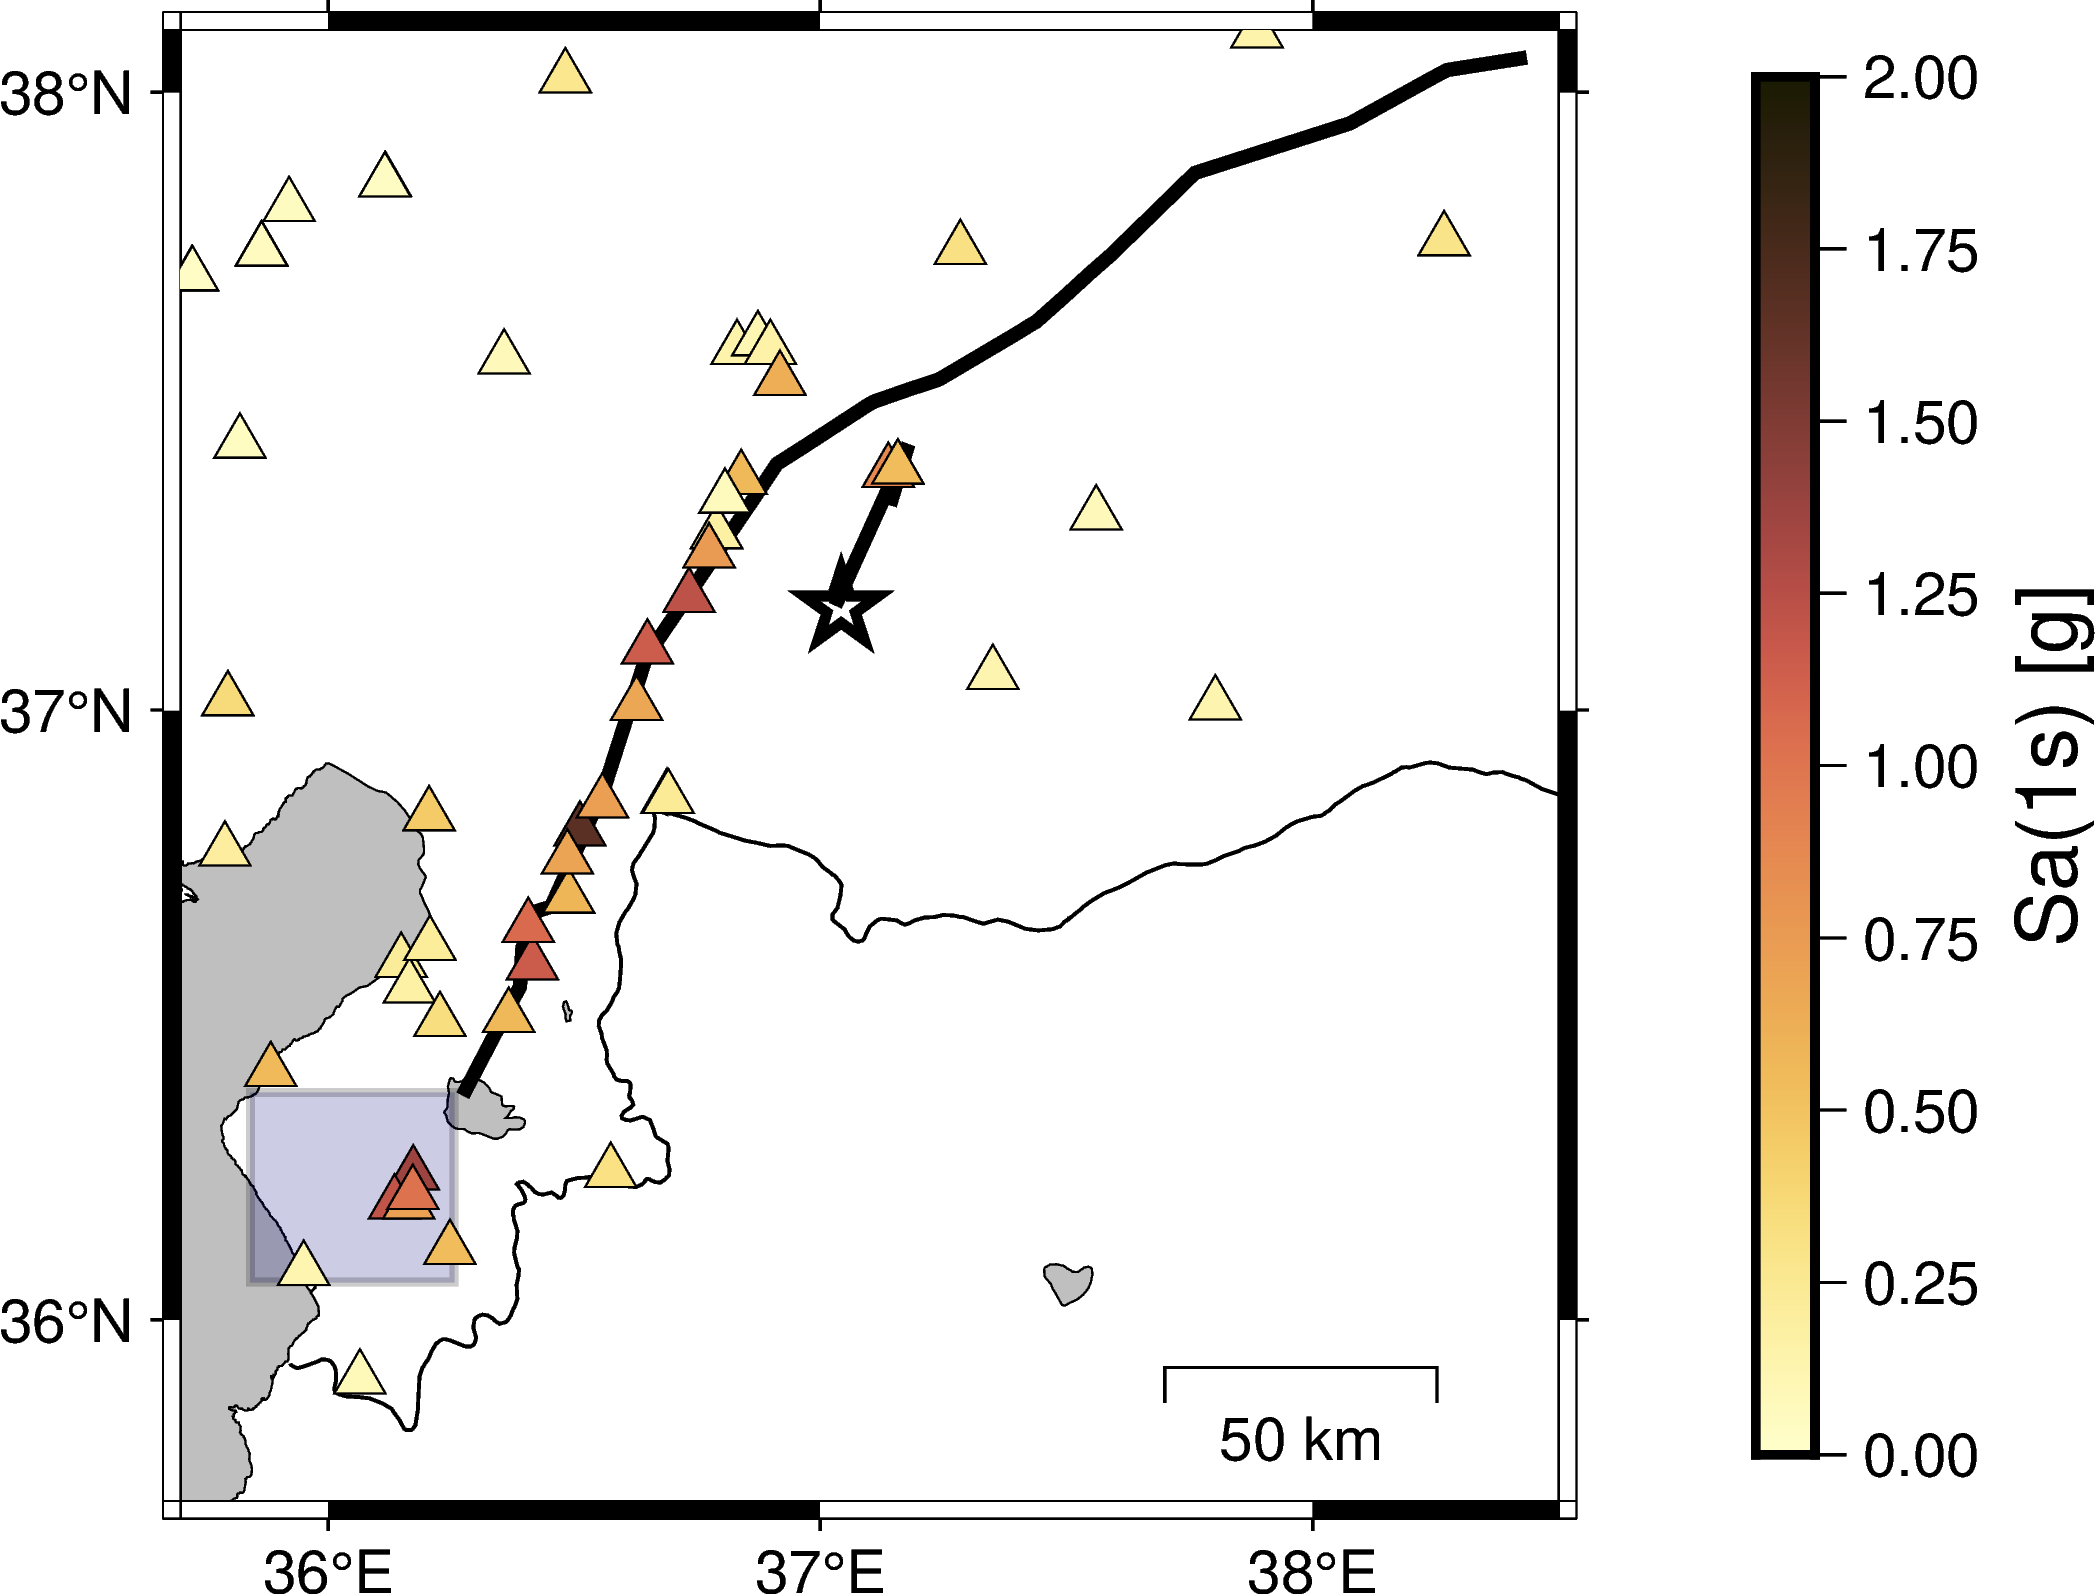
We illustrate the tool using the 2023 M7.8 earthquake at the border of Turkey and Syria. Rupture information and station data (including recorded IMs) are imported from the USGS ShakeMap system and ShakemapSim uses the OpenQuake engine for geo-computations and implementations of ground-motion models.
I developed the tool as part of my PhD in the research group of Professor Stojadinovic at ETH Zürich.
Motivation
In February 2023, a strong M7.8 earthquake occurred at the border of Turkey and Syria resulting in the collapse of thousands of buildings with (too) many people that suffered from tragic losses. In the aftermath of such devastating events, people raise questions whether buildings were adequately designed and, even more, whether building code prescriptions for new constructions are sufficient.
Within days after the event, people posted on social media that at some seismic network stations the recorded response spectrum exceeded the building code response spectrum by a factor of two or more. Thus, suggesting that the observed collapses of new buildings may be attributed to poor building code prescriptions. But is that true?
There are at least two reasons why I think the above conclusions are premature and do not serve as an adequate explanation:
- Modern building codes (such as the one in Turkey) embrace the philosophy of ductile design. Thus, the collapse of a code-compliant building is very unlikely even if the building code response spectrum was exceeded.
- The recorded ground-motion is only representative for a building located directly above the seismic network station. The ground-shaking experienced by other buildings is still uncertain, even if the buildings are located close to that station. This was also pointed out by Peter Stafford after the 2011 Christchurch (New Zealand) earthquake1.
The ShakemapSim tool addresses the second aspect mentioned above: It allows users to compute the probability distribution of ground-motion IMs at specified building locations by taking into account recorded IM values at seismic network stations.
Conducting, validating and developing regional post-earthquake loss assessments requires correlated samples of ground-motion IMs at spatially distributed locations. These samples should be representative of the remaining uncertainty in ground-motions after accounting for recorded IM values.
Example
The following example illustrates the capabilities of ShakemapSim in producing maps of conditional ground-motion IM parameters and generating correlated samples at specified building sites.
Note: All presented results where obtained using USGS ShakeMap data for this specific event (version 12).
The code snippet below shows how to specify and assemble the different model components.
# 1) Specify IM of interest
im_string = 'SA(1.0)'

# 2) Specify ground-motion model (GMM)
gmm = GMM(CauzziEtAl2014(), im_string)

# 3) Specify spatial correlation model (SCM)
scm = EspositoIervolino2012esm(im_string)

# 4) Wrap seismic network stations
stations = Stations(dfstations, im_string)

# 5) Assemble shakemap object
shakemap = Shakemap(Rupture = rupture,
                    Stations = stations,
                    GMM = gmm,
                    SCM = scm)
The specification of building sites for which we would like to conduct predictions and/or sampling is straightforward.
# Specify sites (lon, lat in degrees; vs30 in m/s)
dfsites = pd.DataFrame(data={'longitude': [36.51, 36.62],
                             'latitude': [37.01, 37.10],
                             'vs30': [210, 500]})
sites = Sites(dfsites)
Maps of conditional ground-motion IM parameters
One line of code is enough to predict the probability distribution of ground-motion IMs conditional recorded IM values at specified sites.
mu, var = shakemap.predict_logIM(sites)
The following maps show the parameters of the predicted lognormal distribution (left: median, right: standard deviation) at a longitude/latitude grid in the Turkish region of Hatay.
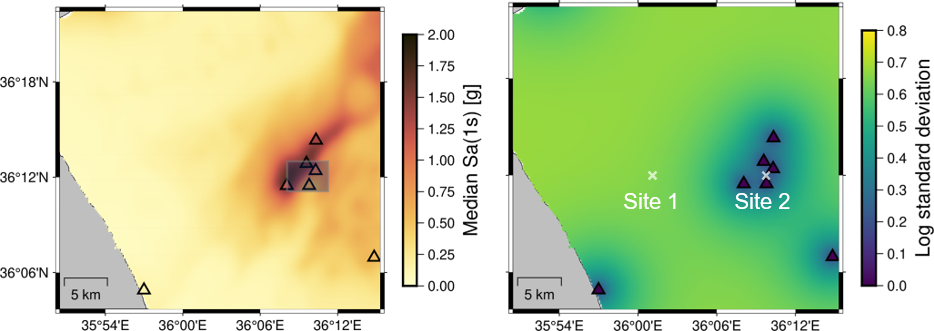
To examine the remaining uncertainties that are involved in IMs at sites that are close to seismic network stations we focus on the two sites indicated in the right panel of the above figure.
| Distances to three closest stations in km | 1 | 2 | 3 |
|---|---|---|---|
| Site 1 | 7.7 | 10.1 | 10.3 |
| Site 2 | 0.8 | 1.1 | 1.8 |
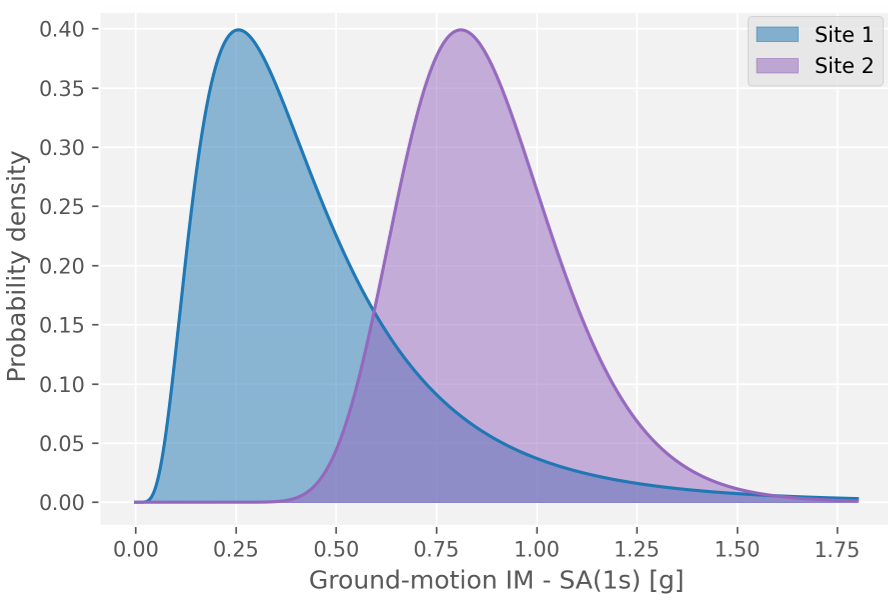
The figure below plots the conditional marginal probability density functions obtained from ShakemapSim at the two sites. It highlights the substantial remaining uncertainty in IMs at the two sites. In particular this also holds true for site 2 which is located very close to three network stations.
Spatially correlated samples of ground-motion IMs
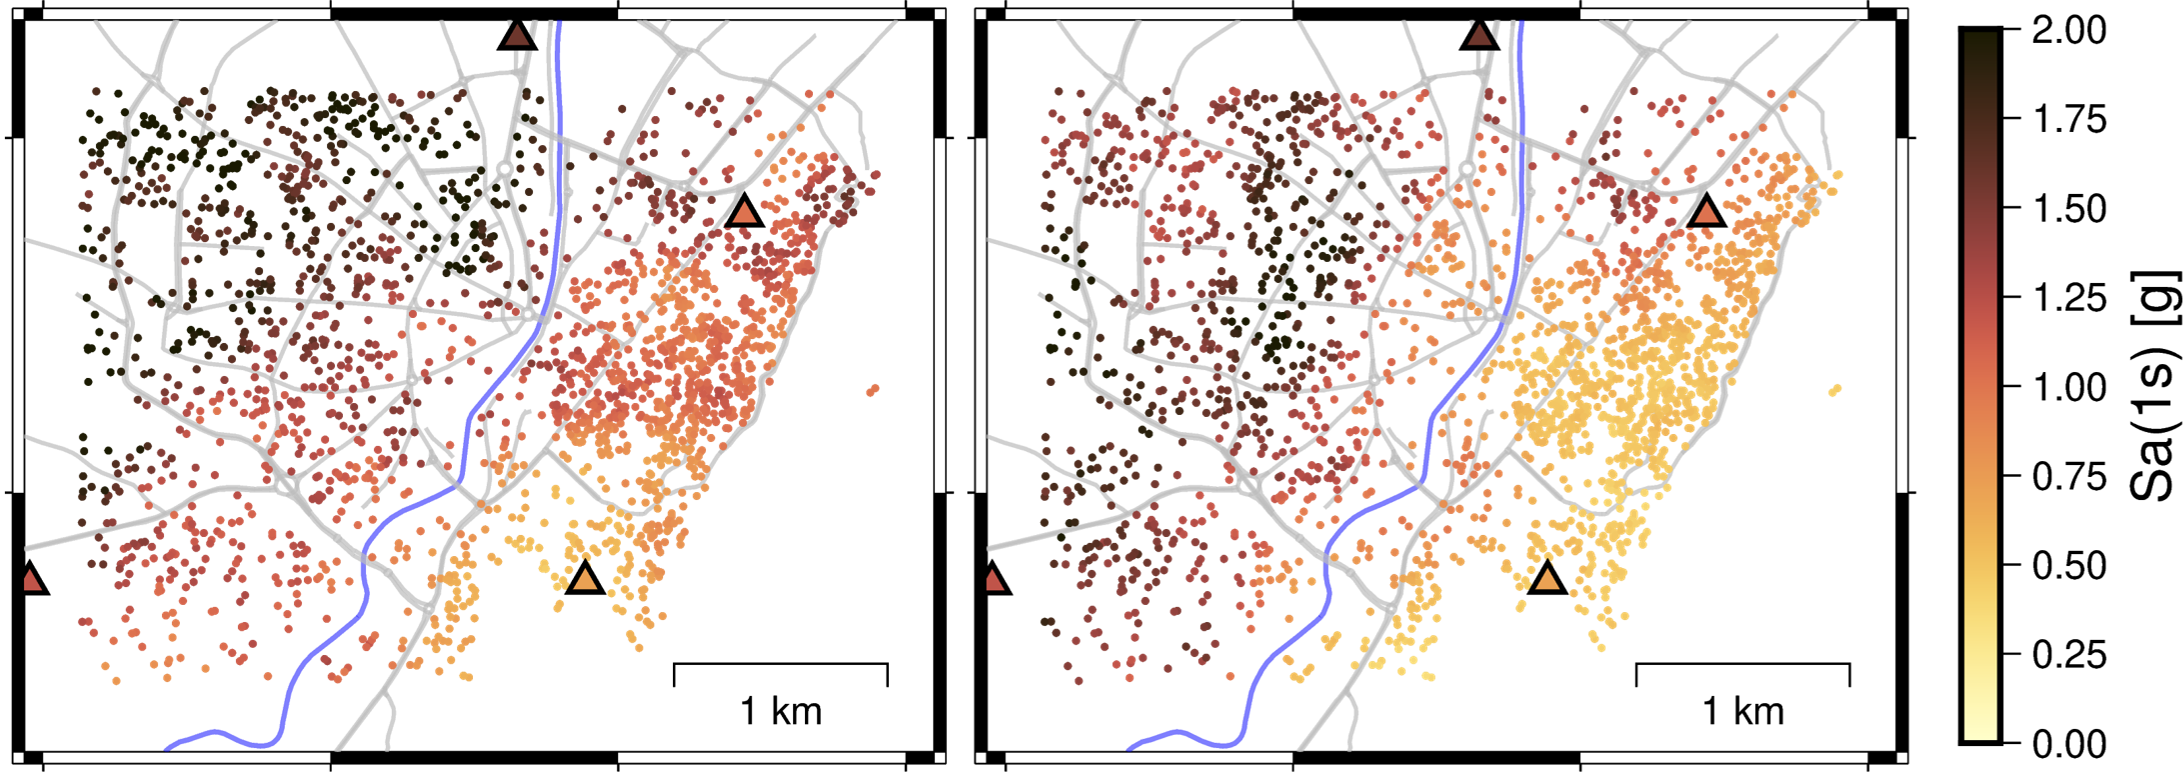
Next we generate two spatially correlated samples of IMs conditional on recorded IM values at locations of 2000 buildings in the city of Antakya (Hatay, Turkey) using following line of code:
sampled_logIM = shakemap.sample_logIM(sites, nsamples = 2)
Such samples (as shown in the figure below) are a starting point for many regional damage, loss and recovery studies. Note that the building sites are distributed over a very small area (…x… km), and that four seismic network stations are located within or close to this area. Despite these facts, the two samples are quiet different at many sites throughout the area. This is further examined below.
For the same 2000 building sites, we will now statistically estimate the probability distribution of the proportion of building sites where Sa(1s) exceeded a certain threshold.
First, we sample a large number (10000 in this example) of ground-motion fields (like those in the figure above). Then, for each sample, we count the number of sites where the IM of interest threshold was exceeded and divide by the total number of sites to get the proportion of sites.
In this example, the IM of interest is SA(1.0) (as defined above) and its threshold is set to 0.75g.
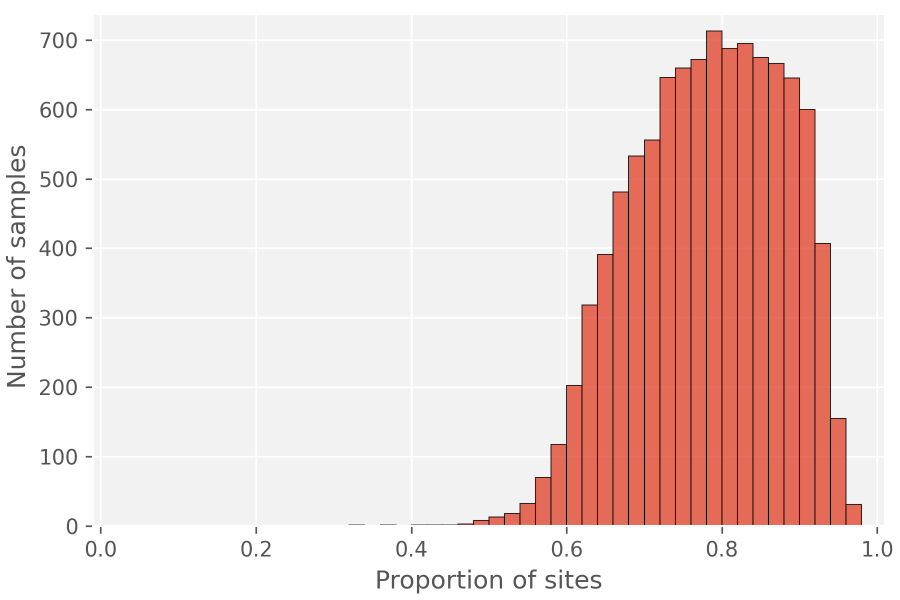
The figure and the stated results indicate that the remaining uncertainty in the ground-motion IM is still substantial: According to this example there is a 90% probability that the proportion of sites where the threshold was exceeded is between 62% and 92%.
Note: These findings are for the selected region, for the IM SA(1s), an IM threshold of 0.75g, as well as for one specific ground-motion model and one specific spatial correlation model. Feel free to re-run the code using the different implemented models (or implement your own models), and vary the region, IM and IM threshold values.
Citation
Bodenmann, L., and Stojadinović, B. (2023): ShakemapSim: Simulate spatially correlated ground-motion intensity measures conditional on recordings (v1.1).
doi: 10.5281/zenodo.7646888 code
References